Debugging an ASIC design in an FPGA-based prototyping system can be a lot like disciplining a puppy. If you happen to be there at the exact moment the transgression occurs and understand what led up to that moment, administering an effective correction might be possible.
Catching RTL in the act requires the right tools. Faults in a complex design are rarely obvious, more likely rooted in a sequence of events sourced from multiple IP blocks partitioned across FPGAs and clock domains. For example, debugging a USB protocol fault calls for capturing a deep trace buffer on the port itself, correlated with streams from other test points in IP blocks and interconnects.

Most FPGA-based prototyping systems are not equipped for deep trace debug operations. FPGAs do not contain enough internal memory to capture very long traces. The Hawthorne effect enters the equation; configuring FPGA resources for debug operations consumes FPGA resources and can affect the outcome of the observation or other operations in unpredictable ways.
Of course, test points never seem to be in the right places at the right time, especially as the root cause of a problem traces farther back into multiple blocks. Having to rebuild an entire RTL design partitioned across several FPGAs just to change the test point configuration for debugging a problem is time consuming and risky.
Most design philosophies use a cascade-up approach: debug the details at the IP block level, then abstract functional blocks as black boxes at system integration. This not only greatly reduces the test point loading, but also reduces system test time and fosters IP reuse – if it all goes as planned.
When Synopsys designed the HAPS-70 Series of FPGA-based prototyping systems, they hit system-level partitioning and interconnect head on, and addressed much of the system-level debugging capability. It became clear that IP block testing needed a similar approach, and to scale down and enable more teams, Synopsys introduced the HAPS-DX. Developers then could design and prototype IP blocks on a smaller, more cost effective platform, and pass artifacts directly up to the HAPS-70 platform for SoC integration.
A big feature of the HAPS-DX is the detailed, deep trace debug capability. HAPS-DX has an 8GB DDR3 SDRAM SODIMM and a suite of logic analysis tools. It can grab 128 signals at 140 MHz, for a full five seconds of data. Synopsys Verdi and Siloti visualization tools can be used to view the results.

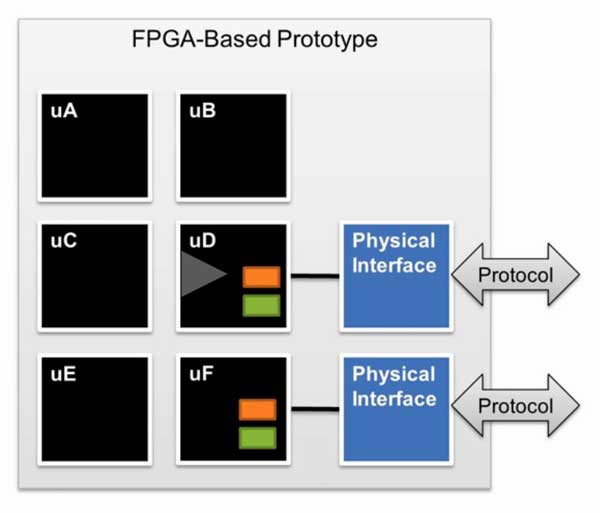
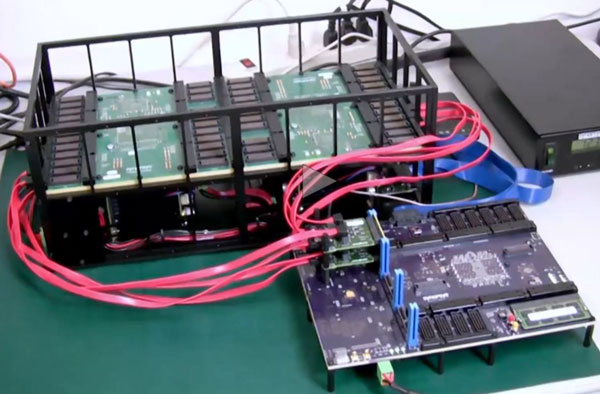
A new, short video from Troy Scott and Peter Zhang of Synopsys shows how the HAPS-70 can be used with the debug features of the HAPS-DX and ProtoCompiler non-invasively. Effectively, the HAPS-DX serves as storage and control for debug operations, connected to watchpoints on the HAPS-70 via high-speed serial links.
This approach leaves the HapsTrak 3 connectors wide open for daughter cards and FPGA interconnect – the partitioning on the HAPS-70 is unaffected. The HAPS-DX captures data, and shares it with a host workstation for display over the high bandwidth UMRBus.

With the capture mechanism in place, ProtoCompiler is used to set triggers. Its RTL Instrumentor allows navigating the RTL design hierarchy visually. A few clicks can set watchpoints or triggers by signal name. A run-time utility then takes over sampling, and can export data in an FSDB format for display and analysis. Results are fully correlated and can be annotated back to RTL source.
This video, “Synopsys ProtoCompiler for RTL Debug with HAPS Systems”, appears with other helpful FPGA-based prototyping videos from the Synopsys marketing and engineering teams.
Related articles:
- End-to-end look at Synopsys ProtoCompiler
- More knowledge, less time in FPGA-based prototyping
- A little FPGA-based prototyping takes the eXpress


Comments
There are no comments yet.
You must register or log in to view/post comments.