Functional coverage acts as a guide to direct verification resources by identifying the tested and untested portions of a design. Functional coverage is a user-defined metric that assesses the extent to which the design specification, as listed by the test plan’s features, has been used. It can be used to estimate the presence of intriguing scenarios, corner cases, specification invariants, or other relevant design conditions inside the test plan’s features. Functional coverage is fully specified by the user or from a system point of view to cover all the typical scenarios and corner cases. Therefore, it requires more up-front effort (the verification engineer must write the coverage model). Moreover, it requires a more structured approach for the verification to shorten the overall verification effort and yield higher-quality designs. It can cover any value of a signal anywhere in the modeled DUT.
This article examines coverage models for the “real” datatype through actual analog devices modeled using SystemVerilog-Real Number modeling devices we used are phase-locked loops (PLL), analog-to-digital converters, and digital-to-analog converters but could be any modeled analog device. The article also shows how a simulator, in this case Questa from Siemens EDA, is used to divide the automatic bins and run the covergroups based on the coverage options that are supported for the “real” datatype. We used the Siemens Visualizer debug environment to clarify how users can debug the simulated values. This was especially important because the number of real-valued bins was huge and needed to be visualized to ensure that the desired values are captured within the modeled design.
Execution of Coverage Metrics Using
A. Cover an interval of an electrical signal
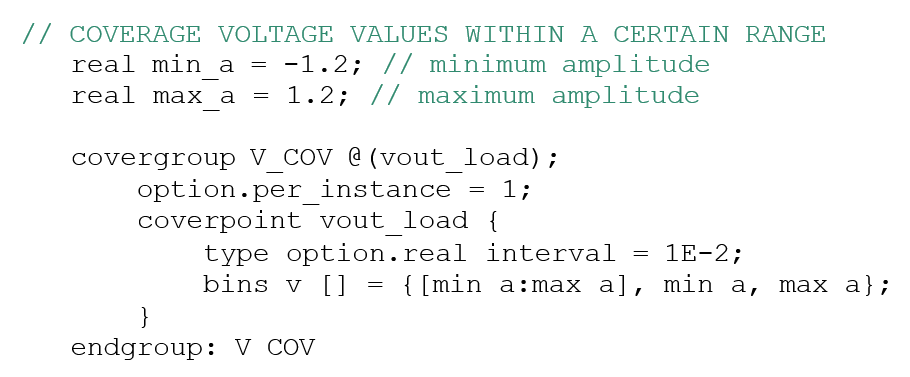
Here we seek to cover an interval of an electrical signal from its low to high amplitude value.

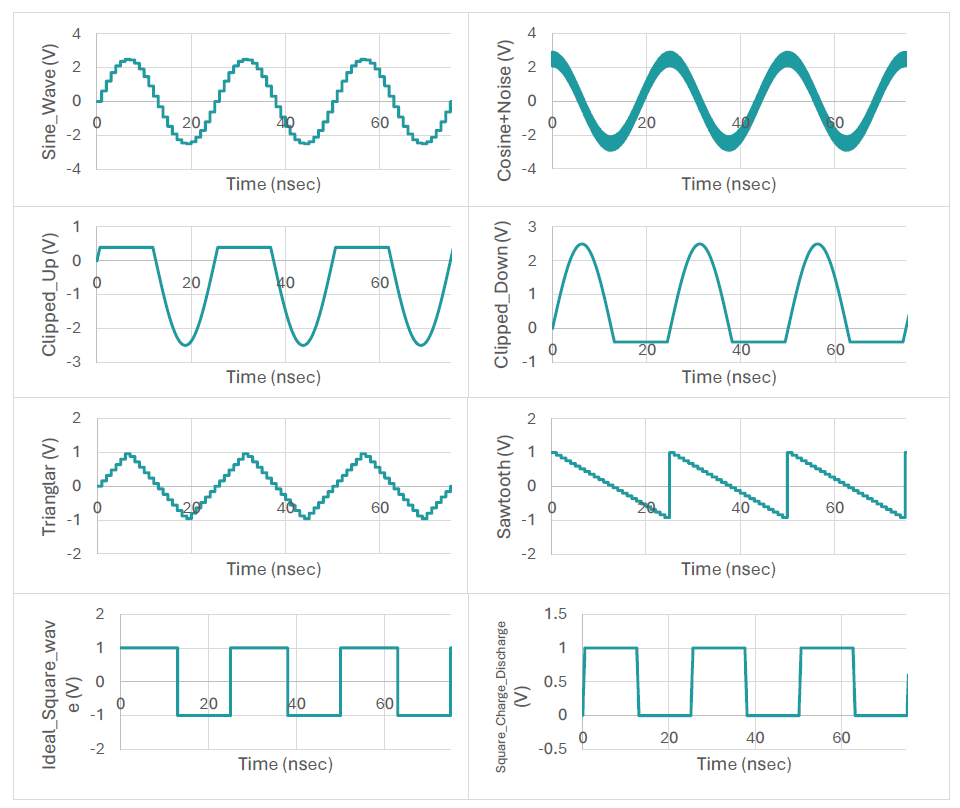
The amplitude could be a negative(-ve) or positive(+ve) analog value, a low or high supply value, or any modeled electrical signal whose value covers a range of a real amplitude datatype. This is helpful in covering any analog waveform with a certain range, such as sine, triangular, square, noisy, and clipped signals, as illustrated in Figure 1.
- Cover -ve to -ve real value
- Cover +ve to +ve real value
- Cover -ve to +ve real value
The covergroup “V_COV” contains one coverpoint “vout_load,” which is associated with bins “v.” Notice that the automatic number of the bins is defined according to the “real_interval” that was passed as a “type_option” and divided according to the number of real values. This means that once a bin is created for a value then no other bin is created for this value, even if the value is repeated within a different range or declared as a separate value.

Table 1 illustrates a simple example of how the number of automatic bins is generated.

B. Cover an electrical signal with a certain tolerance
Here we want to cover an interval of an electrical signal with a certain amplitude with a specific tolerance in its value.

For example, the voltage control of the Fractional-PLL always has a tolerance around its nominal value at the locking time. The verification engineer could increase the expected tolerance to ensure that the undesired values are uncovered. If the undesired values are covered then the modeled system should be changed. Therefore, functional coverage helps in ensuring that the expected values are covered, and the unexpected ones are uncovered, as illustrated in Figure 2. Figure 2(a) shows that the tolerance with the modeled PLL vcontrol increased or decreased by 2% (0.02), which means the values that are greater than (0.42) and less than (0.38) will not be covered, because we want to cover the unexpected values to capture the weird behaviors within the system. Figure 2(b) shows the desired values with the preferred tolerance of about 2% after the designer modified the modeled DUT to meet the system requirements. Notice that coverage collects the undesired values and allows the user to adjust the modeled system, resulting, in this case, in the values becoming less than (0.42) and greater than (0.38), which will maintain system correctness.

C. Cover a signal value when another event occurred
Now we seek to cover a signal value with a certain range or reach specific values when another signal occurred, or we want to cover the output values when an input occurred. For example, the charge pump within the PLL reaches (Icp) when the reference clock is leading the feedback clock and reaches (-Icp) when the reference clock is lagging the feedback clock.

D. Cover a set of parameters that maintain the stability of the system
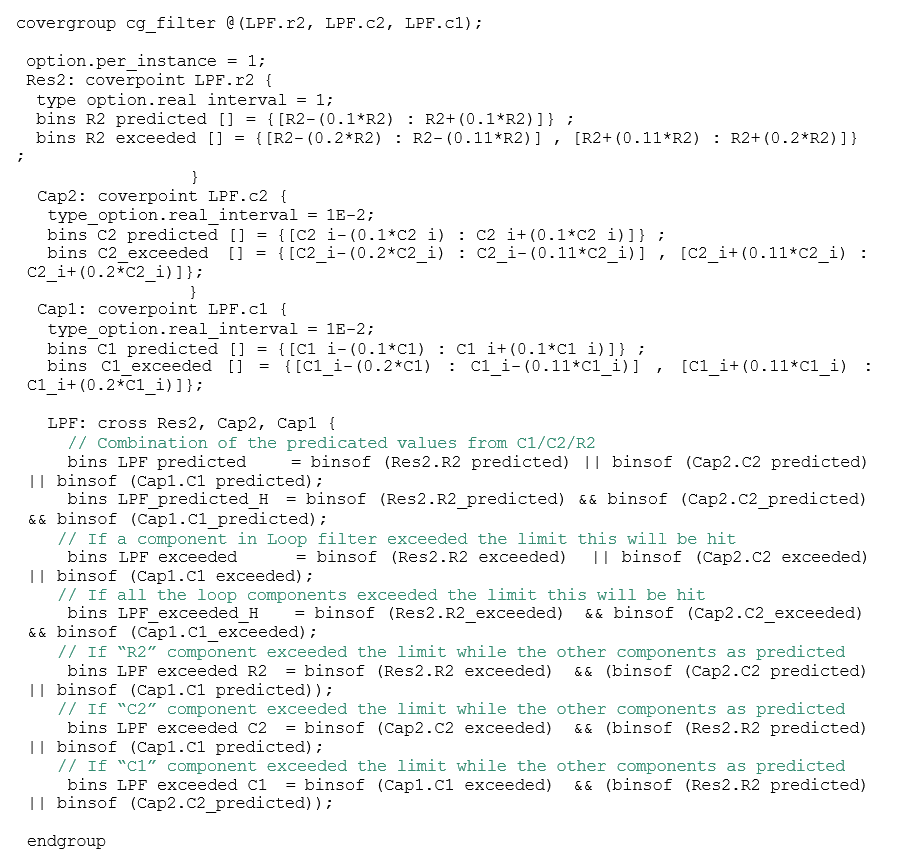
The verification engineer can predict the boundaries in the parameters variations that maintain the stability of the system by putting the expected variation in each component/parameter value through a certain bin to cover (bins predicted) and another bin within the unexpected variation that exceeded the desired variations within the parameters (bins exceeded). The verification engineer should have the predicted bins to be hit rather than the exceeded bins, otherwise the system could be unstable. Therefore, the verification engineer can use the coverage metrics to collect the trade-off variations within the system.
For example, figure 3 illustrates the stability of a certain PLL system by calculating the open loop response under the provided variation components in Table 2. So the verification engineer will build a covergroup for each component with the expected and exceeded variations, then apply cross-coverage between these covergroups to ensure that the collective metrics between covergroups are preserved according to system specifications.

Table 2. Expected variation for each loop component/parameter and PM values that maintain stability.

Listing 4 is the provided covergroup for the loop filter components only (the first row in the Table 2) to illustrate the idea, but the user needs to build cover metrics for all the trade-off possibilities.

Debug Coverage Metrics Using a Debug Environment
There are two modes that the user can choose between during debugging the coverage statistics. These modes are “view coverage” and “coverage debugging.” In the view coverage mode, the user debugs the coverage statistics results from the simulator without design or testbench debugging, while with the coverage debugging mode, the user can debug the coverage results together with the design and/or testbench debug.
The “covergroups” window displays the coverage results for SystemVerilog covergroups, coverpoints, crosses, and bins in the design. The Visualizer debug environment was used on the example listed in section D to show how it can help the functional verification engineer visualize functional correctness with the modeled design using the “covergroups” window.
The first case (shown in figure 4) illustrates that either there is no mismatch in the loop filter components or the mismatch is as expected, which is about 10% (as illustrated in table 2) thus maintaining the stability of the system. This means that the first two bins in cross “LPF” will be hit only while the others are not hit. Therefore, the first two bins “LPF_predicated/LPF_predicated_H” help in knowing that the desired values will be covered, but that does not mean the undesired values are uncovered except if the last five bins are un-hit (LPF_exceeded/LPF_exceeded_H/ LPF_exceeded_R2/ LPF_exceeded_C2/ LPF_exceeded_C1).

The second case illustrates when a component in the loop filter has a mismatch while the others have the expected values. The last three bins (LPF_exceeded_R2/LPF_exceeded_C2/LPF_exceeded_C1) are helpful to track the component that caused the mismatch. Many components probably exceed the predicted values. Figure 5 illustrates that the “C2” component has a mismatch and therefore the “LPF_exceeded” bin is also hit because at least one component has a mismatch

The third case (shown in figure 6) illustrates that all the components have mismatches and exceeded the predicted values when the bin (LPF_exceeded_H) is hit. The design and verification engineers need to work together to allow the mismatches to go from the worst case, “case 3,” to the best case, “case 1,” as that is the first cast that will allow the system to be stable with the functional correctness. The bin “LPF_exceeded_H” is hit 582 times, which means that the three components are incorrectly modeled together 582 times through the simulation run.

Conclusion
SystemVerilog functional coverage can help verification engineers that used to model the analog signals in digital environment in the following:
- Ensuring any “real” signal is covered under a certain amplitude This amplitude range could have tolerance due to any mismatch within the circuit.
- Helping to capture the mismatches within the circuit components that may cause the system to behave correctly or not.
- Verifying that a certain functionality of any system sub-block is
To read more on this topic, please see the new whitepaper from Siemens EDA, Functional verification of analog devices modeled using SV-RNM.

Mariam Maurice is a Product Engineer for Questa Simulator with a focus on RNM and the Visualizer Debug Environment at Siemens Digital Industries Software (DISW) in Electronic Design Automation (EDA). She received the B.Sc. (Hons.) and M.Sc. degrees in electronics engineering from Ain Shams University (ASU), Cairo, Egypt. Her research interests include analog/mixed-signal (AMS) integrated circuits and systems, system-level design, modeling AMS behaviors using hardware description languages, and Functional Verification.
Also Read:
Automating Reset Domain Crossing (RDC) Verification with Advanced Data Analytics
Smarter, Faster LVS using Calibre nmLVS Recon
Siemens EDA Offers a Comprehensive Guide to PCIe® Transport Security
Share this post via:


Comments
There are no comments yet.
You must register or log in to view/post comments.