Recently, I reported on my conversation with Cristian Amitroaie, CEO of AMIQ EDA, about automated generation of documentation from design and verification code. Before we chose that topic for a post, Cristian described several capabilities of the AMIQ EDA product family that might be of interest to design and verification engineers. For today’s post, I’ve selected runtime elaboration of Universal Verification Methodology (UVM) code because I wanted to know more about the benefits for engineers working on real-world chip projects.
What do you mean by elaboration?
When our tools read in design and verification code, we check for a wide variety of errors, and then we build a complex internal model that reflects every aspect of the code. For example, in our Design and Verification Tools (DVT) Integrated Development Environment (IDE) family, we perform a full design elaboration. That means we build a model with the complete design hierarchy and all the proper parameters computation, generate blocks computation, binds, etc. This allows design engineers to explore design hierarchies, trace signals and parameters, draw schematic diagrams, and perform many other useful tasks.
How do you handle verification code?
We also build a complete model for verification environments, which are usually based on UVM. Verification engineers often partially mirror the design hierarchy by a tree of components such as drivers and monitors organized in UVM testbench components. They also define and instantiate verification-specific components such as scoreboards and sequencers. All the components are connected together using transaction-level modeling (TLM) ports, defining a verification topology.
Is the verification topology like the design hierarchy?
In some ways yes, but verification topologies are not defined in a static manner like design hierarchies. There is no top module instantiating submodules, and so on, that can be statically computed. The verification topology is controlled per UVM test by activating or deactivating drivers, replacing some components with others tuned to match specific test requirements, connecting specific components to specific design interfaces, etc. The UVM verification component hierarchy is constructed by executing a specific UVM flow at simulation time 0. During this execution, all configuration via the “config db” setters/getters mechanism is performed, all the factory overrides are applied, and more.
What does this mean for DVT IDE?
The bottom line is that verification elaboration cannot be completed until UVM phase 0 (activity at time 0) is executed. We could have called a third-party simulator for this execution, but that takes time and adds overhead. Instead, DVT IDE actually performs a “run 0” internally to allow all the UVM elaboration to happen. We call this process UVM runtime elaboration to reflect its non-static nature.
How does this work in DVT IDE?
Users can ask for the runtime elaboration of a specific UVM test and use breakpoints to debug the “run 0” execution. When a breakpoint interrupts the execution, users can browse the call stacks on each parallel thread and inspect variables. We provide different types of breakpoints, which can be conditional. Users can browse the function call stack and all the breakpoints they’ve set in their project. They can also step through the executed code and inspect variable values, add log points to print information without altering the verification code, and add watchpoints to interrupt upon variable changes.
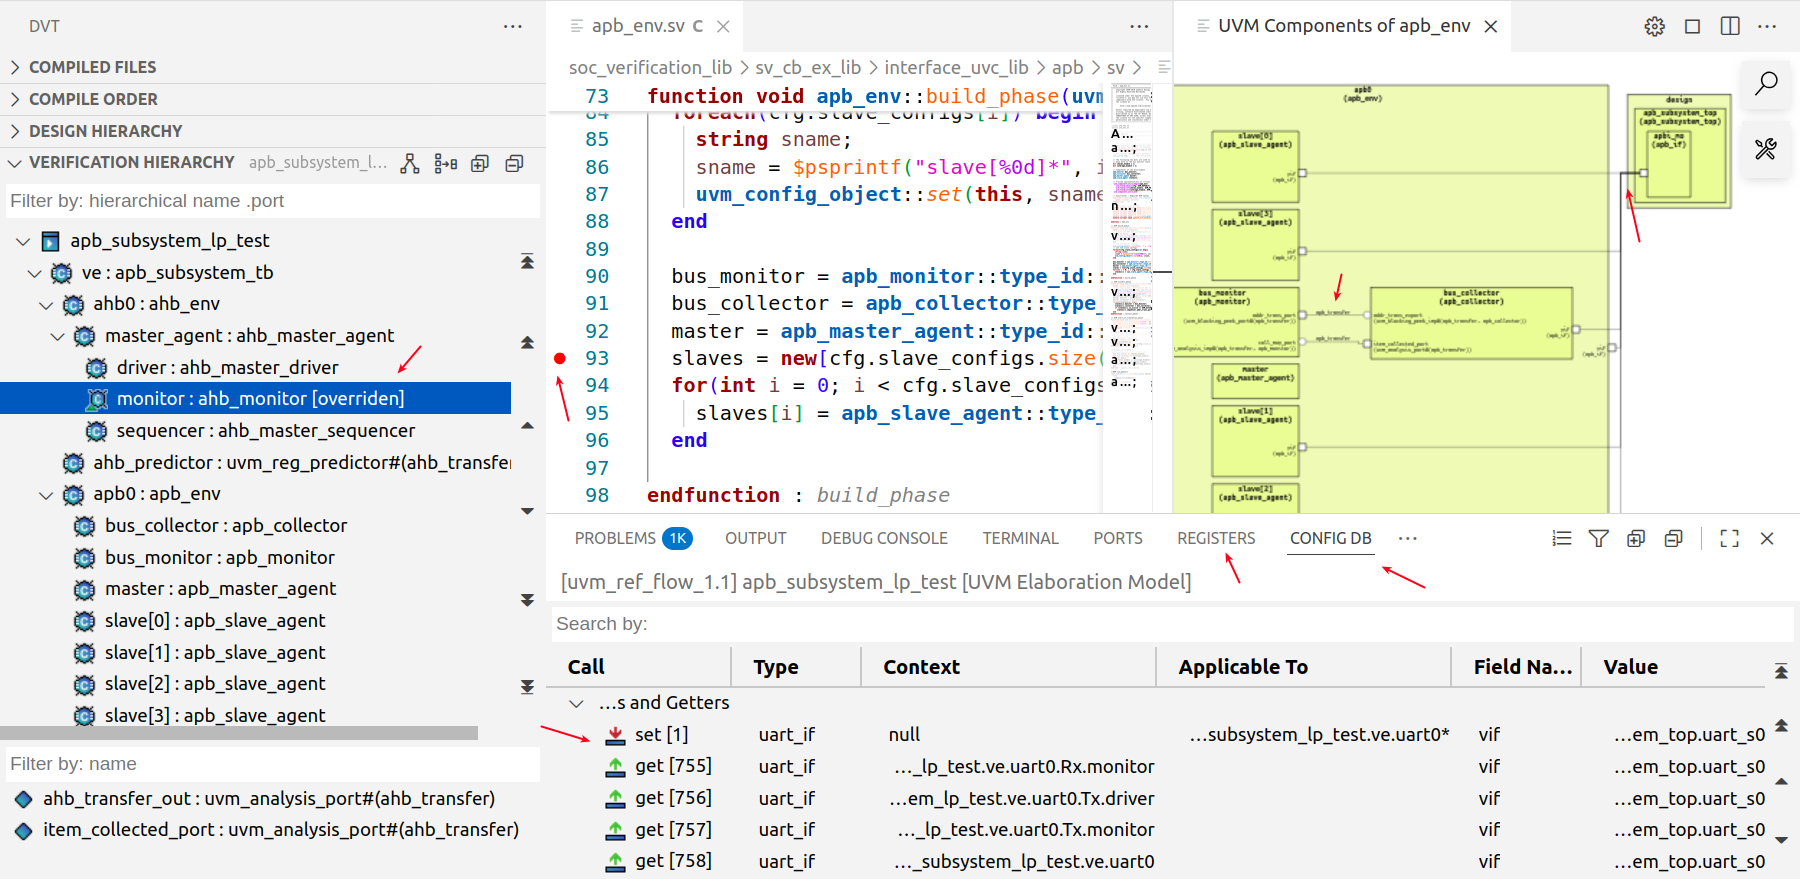
During UVM runtime elaboration, DVT IDE collects information about factory override definitions and if/where they are applied; information about the config database, including set/get calls and how they are paired; information about the register model, including address and bitfield computation; information about which physical interfaces are connected to virtual interfaces; and information about TLM port connections.
How does this help engineers create, explore, and debug the verification topology?
All this information collected is available in DVT IDE to help engineers explore their verification topology, the tree of components, the register model, the config db, and more. DVT IDE can also display a diagram of all the nested components, including their connections via TLM ports and their connections to the design via virtual interfaces. This is called the UVM Components Diagram.

We can determine some of this verification topology statically, but runtime elaboration allows us to compute actual data that perfectly matches what would happen in a simulator at time 0. Users get all the benefits I’ve mentioned without having to access a simulator. This saves time since the internal UVM runtime elaboration is faster than invoking an external tool that builds a model for full simulation.
What other capabilities benefit the users?
Three things spring to mind. First of all, many verification environments use C models in addition to UVM SystemVerilog code. We support DPI-C calls during “run 0” so this is not an issue. Second, if the verification code changes, users don’t have to go through the compilation and design elaboration process all over again. DVT IDE incrementally analyzes the changes and performs the UVM runtime elaboration. Finally, after the elaboration is done, we save a database that users can load anytime. This means that if there are no changes to the UVM topology, verification engineers can simply load the snapshot without having to execute runtime elaboration again.
Any final thoughts?
The capabilities I’ve listed are robust and well proven by many users over several years. In this post, I’ve only given an overview. To find out more, I recommend a concise tutorial available on our website. Of course, interested verification engineers can contact us to schedule a demo or request an evaluation license.
Thank you for your time, Cristian.
Likewise, and Happy Holidays!
Also Read:
Better Automatic Generation of Documentation from RTL Code
AMIQ EDA at the 2025 Design Automation Conference #62DAC
2025 Outlook with Cristian Amitroaie, Founder and CEO of AMIQ EDA
Share this post via:


Comments
There are no comments yet.
You must register or log in to view/post comments.