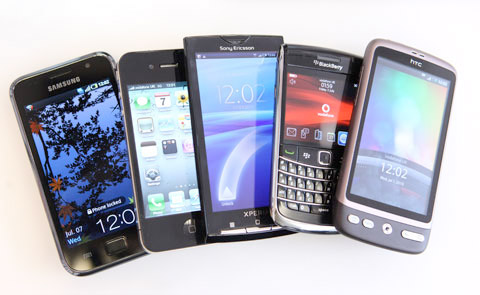
 The numbers for smartphone sales in Q3 are starting to roll in. These are in units and not yet revenue (let alone profit) numbers although everyone down to Sony is for sure profitable. Samsung is running away with the volume, selling more than Apple, Huawei and Sony put together. One name that is missing is Motorola (Google) which has dropped out of the top 10, and one name that is almost missing is Nokia which is now in tenth place (they were 3rd last quarter so it is a big fall). Whether Google has the stomach to keep Motorola going and whether Microsoft has the stomach to keep Nokia going (or buy them) are interesting questions to watch.
Everyone except Apple, Nokia and RIM are based in Asia. I’ll be surprised if Nokia makes it into the top 10 in Q4, and I wouldn’t even be surprised if RIM (Blackberry) fell out too. That would make it the battle of the As: Apple and Asia. For the time being, Apple’s position as a premium supplier at the top of the market is probably secure, but the more mature the smartphone market becomes the harder it is to differentiate and thus demand a premium price. So far, by building their own chips, they have kept their performance edge. It will be interesting to see if Huawei, which has rocketed up the chart from 8th to 3rd, can continue and overtake Apple in volume (although for sure not in revenue or profitability).
Another interesting thing to watch will be 20nm application processors. These probably won’t come until late 2013 or early 2014, but while they may bring better power and performance numbers they make come at a price. For the high end of smartphones, retailing at several hundred dollars (with no contract) this is probably a non-issue. But smartphones go all the way down to BoM prices in the $50 range with retail prices around $75. There is not much room in there for increasing costs. I still think the implications of 20nm manufacturing costs haven’t been completely absorbed. Historically the main driver of Moore’s law has been economics not technology.
Rank (previous) . . Manufacturer . . . Sales in Q3
1 (1) . . . . . . . . . . Samsung . . . . . 56.2 Million
2 (2) . . . . . . . . . . Apple . . . . . . . . 26.9 Million
3 (8) . . . . . . . . . . Huawei . . . . . . . 16.0 Million
4 (7) . . . . . . . . . . Sony . . . . . . . . . 8.8 Million
5 (5) . . . . . . . . . . ZTE . . . . . . . . . . 8.0 Million
6 (4) . . . . . . . . . . HTC . . . . . . . . . . 7.8 Million
7 (6) . . . . . . . . . . RIM . . . . . . . . . . 7.4 Million
8 (9) . . . . . . . . . . LG . . . . . . . . . . . 7.2 Million
9 (11) . . . . . . . . . Lenovo . . . . . . . . 7.0 Milllion
10 (3) . . . . . . . . . Nokia . . . . . . . . . 6.3 Million
Source: TomiAhonen Analysis from vendor and market data
Share this post via:


The Foundry Model Is Morphing — Again