 I talked with a mystery person earlier this week. I would love to tell you his (or her) name and the company he (or she) works for but they are the sort of company that doesn’t casually endorse any suppliers so it all has to remain anonymous. But they have been a customer of Pinpoint, originally from Tuscany Design Automation until late last year when Dassault Systemes acquired the company. They have been using it in production designs for about 18 months.
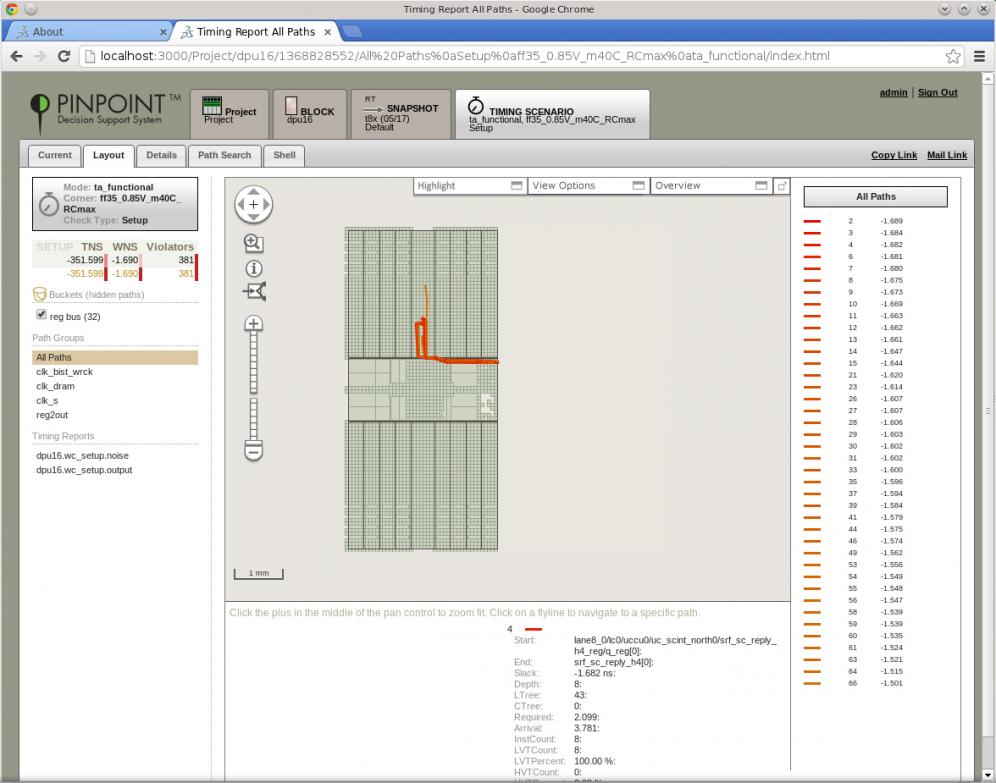
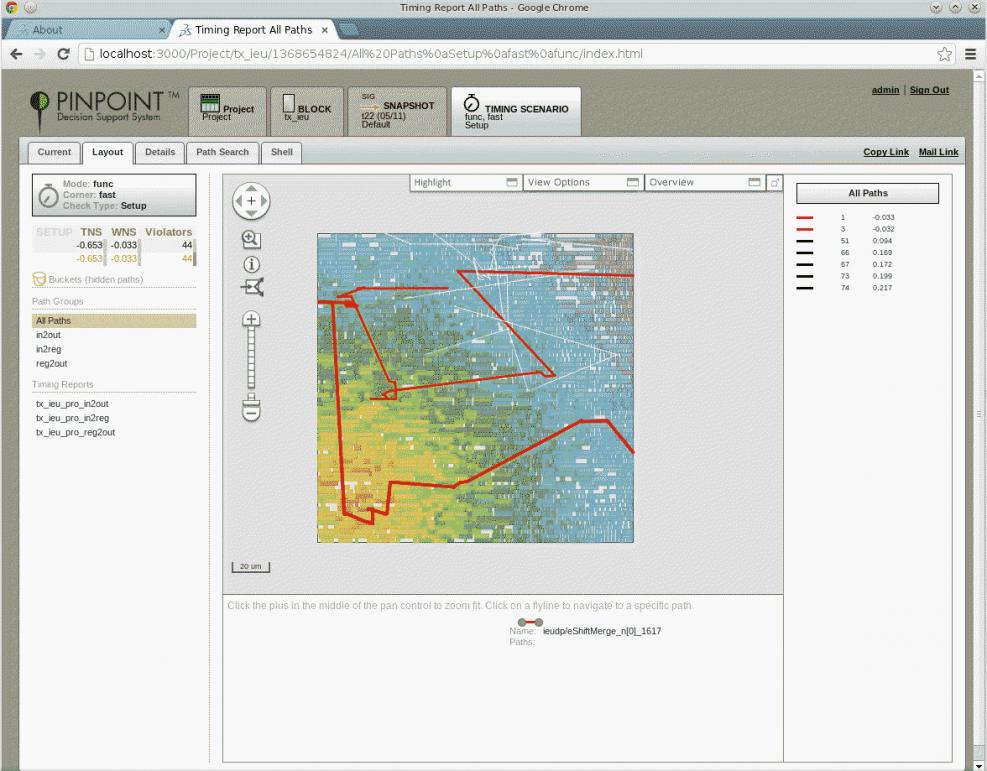
Like most big semiconductor companies, they have multiple internal dashboards that have been homegrown. But Pinpoint is unique since it does not just pull status reports and metrics together in one place, it provides all the information needed to visualize a problem, debug the problem, plan the fix and make decisions from within a single browser window. Without the information Pinpoint provides it is often unclear what approach should be taken: if a path misses timing is it an RTL problem, a routing congestion problem, bad power grid, poor placement, or a bad floorplan. All of these are possible reasons and with only a timing report and a perhaps the layoutit is almost impossible to guess which is the root cause and thus whose job it is to try and fix it.

Unlike internal dashboards, Pinpoint makes it possible to look at the actual paths of interest (not making timing, say), see where they run in the layout and overlay it with other relevant information. The company now uses Pinpoint to drive their weekly project meetings when they are in design closure. They also use it as a focus to get RTL designers more involved since all the information is available through a browser window. The design team goes all the way from RTL to GDSII with very tough timing and power requirements. So RTL designers need to work closely with the physical team, they are not “just” taking pre-designed RTL IP from another group and integrating it into an SoC.
They are also starting to use Pinpoint as a way to communicate to geographically dispersed teams. Most of the team is in one site but there are people at a couple of other sites and PinPoint makes it easy to have a common view for discussion.
They have customized Pinpoint in a number of ways, firstly to add internal metrics that they sometimes use and also to overlay information from different sources such as power analysis maps from specialized power analysis tools, or congestion maps from routers, or thermal maps. This is something that is hard to do in the individual tools since they are usually only designed to display their own data graphically.

Another big saving is that Pinpoint provides visualization of physical design, timing paths etc without pulling down an expensive license of PrimeTime or the place & route tools during this analysis and debug. It is not just a financial saving, there is a big saving in time in avoiding needing to reload the whole design/block.
During physical design regression (the nightly run) all the data is automatically updated into Pinpoint. When a designer is playing around with multiple experiments, he/she can flag their best run and control the collection of the metrics. Pinpoint can track the historical progression of the various metrics and the status of the design, and that data is always maintained and visualizable even if the original source data (DEF, LEF, Primetime reports, etc) have to be deleted to make disk space available for future iterations.
Share this post via:


Musk’s Orbital Compute Vision: TERAFAB and the End of the Terrestrial Data Center