



I’ve been working with AMIQ EDA for almost nine years now, writing about their cool technologies and interviewing users about their experiences. I’ve read through more user guides and release notes than I can count. I’ve watched many dozens of video clips showing how to use their products. I’ve even visited their headquarters in Bucharest multiple times to sit with their engineers and learn what’s on the horizon. I can honestly say that, across all this interaction, nothing has impressed me quite as much as the capabilities shown in a recent demo.
One reason this particular demo is so interesting is that it entails the use of AI to help with a common and challenging aspect of semiconductor development. Like many others, I’m constantly impressed by how rapidly and how deeply AI is changing this industry. In fact, some engineers are concerned that the use of generative AI (GenAI) to produce design and verification code will degrade their skills or make their jobs so boring that they’ll no longer find them worth pursuing.
They should not however, worry about the role of AI in automating routine, repetitive, and sometimes tedious tasks that take up a good portion of a chip engineer’s day. Anything that makes humans more productive and enables them to spend more time on the creative aspects of their jobs sounds like a win to me. Debugging simulation test failures is one of those tasks that takes a lot of time and effort. The “aha!” moment when a verification engineer finds the exact root cause of a failure is rewarding. All the juggling of files and alignment of timelines leading up to that is much less interesting.
That’s exactly the part of the process that AMIQ EDA has focused on. This demo shows how their DVT waveform and log analysis tools power AI-driven test failure root cause analysis (RCA). A typical testbench based on the Universal Verification Methodology (UVM) standard is highly complex. The simulation tests that run in this environment to verify huge chip designs generate very large log and signal change (waveform) files. Each test failure must be debugged to find out whether it is due to a flaw in the design or an error in the testbench. This is often a tedious, multi-step process:
- Find the UVM error in the log file
- Correlate the failure to the source code
- Trace the issue across both the testbench and design hierarchy
- Manually add signals to a waveform view to see how they evolved during the test
- Piece together what went wrong and find the precise error
- Make a trial fix and re-run the test to see if the error disappears
At some point during the fifth step, the process gets interesting and the “aha!” moment comes. Everything leading up to that can be automated by AI, and that’s what the demo shows. The Root Cause Analysis profile in the AMIQ EDA DVT AI Assistant orchestrates a specialized AI agent to drive the entire debug workflow autonomously. The verification engineer simply opens the AI Assistant panel, selects the profile, and types in a simple prompt such as “investigate the test failure.”
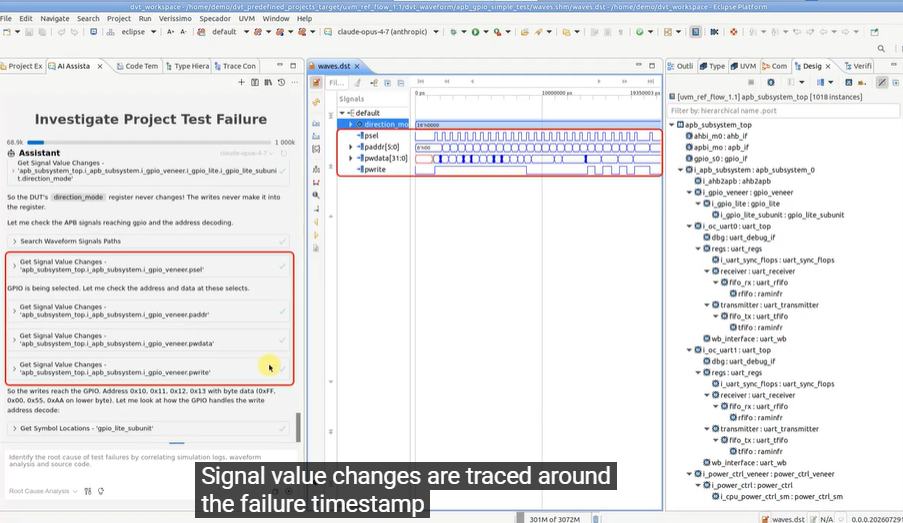
As the demo shows, the agent starts by identifying the correct log and waveform files. The log file tool parses the raw simulation log into structured UVM messages, allowing AI to instantly sort, filter, and isolate the preceding events that triggered the failure. The waveform tool then selects relevant signals in the waveform file and investigates value changes and causal relationships around the timestamp of the failure. This allows it to reconstruct a timeline of events leading up to the failures.
The AI agent queries the waveform for changes of relevant signals at key timestamps. It also uses compiler-backed code navigation to explore the source code and to understand both the verification environment and the underlying design hierarchy. The final output is a nicely formatted, highly structured report. It displays a chronological step-by-step chain of events with timestamped evidence linking log messages directly to waveform data. Clickable hyperlinks allow the users to instantly cross-correlate the data and zoom in quickly on the root cause of the failure.
I was impressed by how much routine busywork this automation eliminates. My main question was how this capability is made available. I learned that it is included within AMIQ EDA DVT IDE for both Visual Studio (VS) Code and Eclipse users. What’s really interesting is that external AI agents can also access this root cause analysis solution via the AMIQ EDA DVT MCP Server. In an external agent such as Cursor, Claude Code, Codex, Copilot or Kiro., a user can install the companion skills, start the MCP Server, and execute a very similar debug query.
It seems to me that this demo shows exactly what AI does best: automating routine tasks and presenting complex information in a way that allows humans to make better decisions. DVT AI Assistant’s Root Cause Analysis profile orchestrates an AI agent that parses simulation logs, explores waveforms, and navigates source code to produce a structured, evidence-backed failure report. The AMIQ EDA team informed me that this impressive RCA capability is evolving and improving constantly. I’d love to hear what others think of this video demo in the comments section.
Also Read:
Improving Verification of Battery Cell Monitoring Chips
Giving AI Agents Access to a Compiled Design and Verification Database
2026 Outlook with Cristian Amitroaie, Founder and CEO of AMIQ EDA
Share this post via:


Comments
There are no comments yet.
You must register or log in to view/post comments.