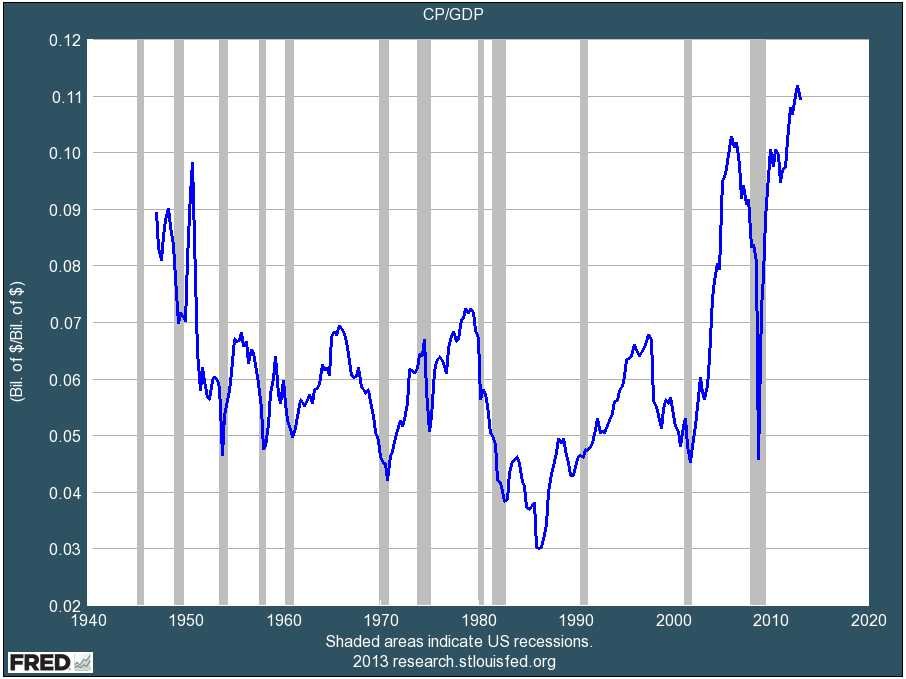
After driving to Silicon Valley for the past 30 years I am acutely aware of traffic patterns and to me that directly relates to the economy. The recession of 2009 really hit traffic patterns with what I would estimate as a 20% unemployment rate in Silicon Valley. I could leave my home in Danville anytime of the day and have no traffic … Read More


